How we're supporting local authorities with spatial planning and carbon modelling

The challenge:
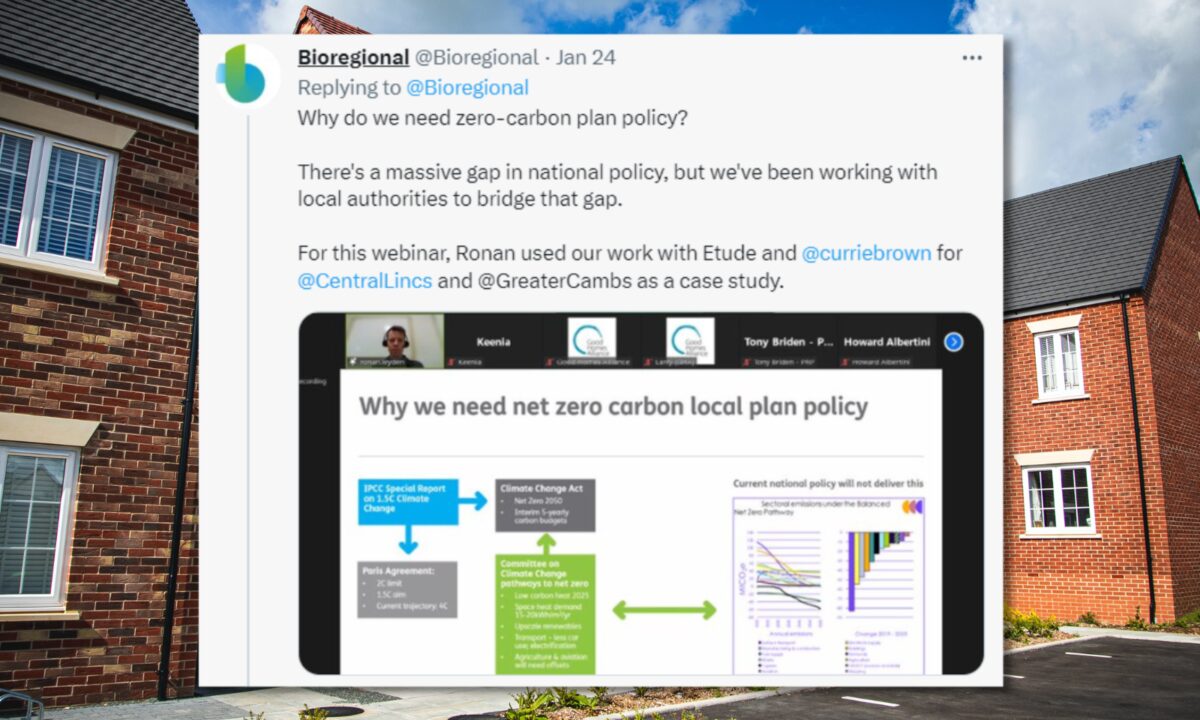
More than 300 UK local authorities have declared climate emergencies. The IPCC has published its special report on 1.5°C, and the Climate Change Act was published way back in 2008, but there’s still a significant gap between what’s needed for the UK to meet its own legally binding climate targets, and current national policy.
Bioregional has been working with local authorities to bridge that gap by providing the evidence base they need to create new net-zero local planning policies.
How we helped:
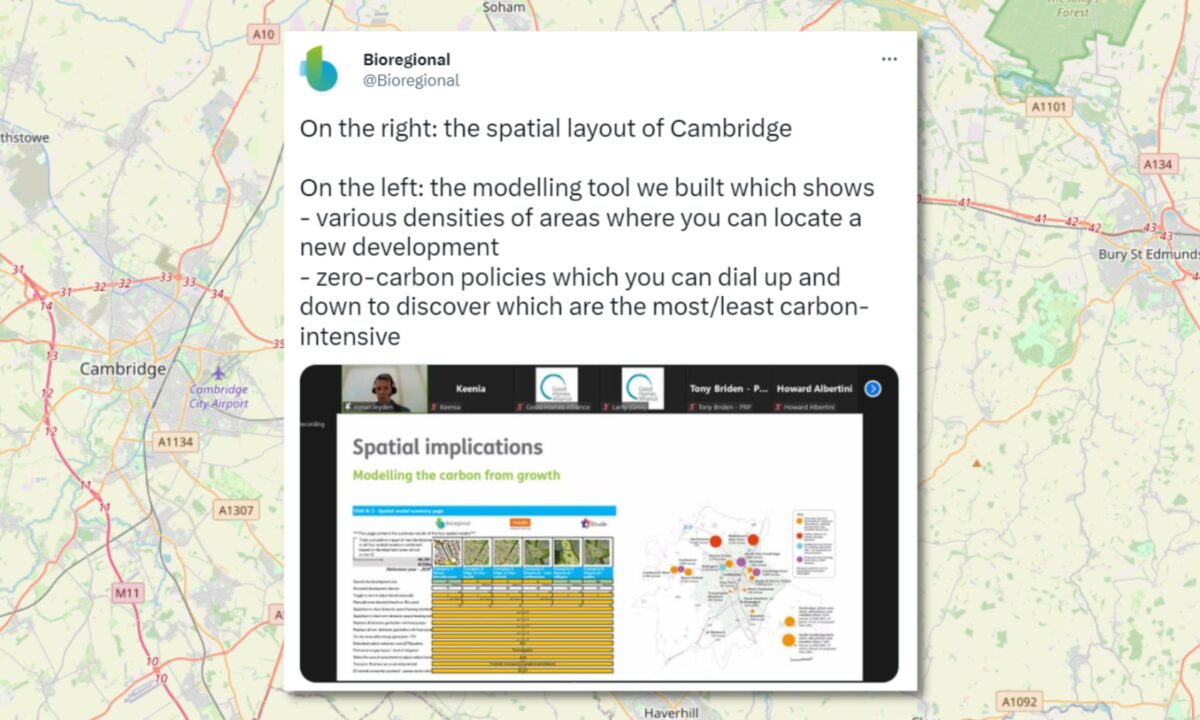
Working with partners Etude, Currie & Brown, Mode Transport, Bioregional created evidence bases and policy wording for net-zero local plans for Central Lincolnshire and Greater Cambridge. As part of this extensive work, we modelled the spatial implications of proposed growth, across alternative locations and at differing densities.
We created a tool that allows local authorities to model the annual carbon footprint that would be generated by new development, depending on where that development takes place and what policies are applied to it.
For Greater Cambridge, we worked with the local planning authority to establish six categories of location, from dense urban areas through to dispersed villages. Location matters because of the transport habits that new residents or workers will develop, depending on the distance they need to travel and the public transport service available locally. But beyond that, different locations vary in the size of development that tends to be built, and the amount of new infrastructure that must be built alongside new homes. For example, residents of new homes in urban areas can (to some extent) make use of existing schools, healthcare and so on, while new homes in less well-served areas often need more new infrastructure to be built. This means that additional carbon will be emitted when building and operating this new infrastructure.
Our tool also models various net-zero carbon policies on top of the location - eg, best-in-class energy efficiency; replacing gas boilers with heat pumps; adding on-site PV; reducing the embodied carbon, and various measures to promote sustainable transport (walking, cycling, public transport and electric vehicles). Our tool gives local authorities the ability to dial up or dial down their policy choices, and rearrange the spatial distribution of the new development, in order to understand the least carbon-intensive options for new growth.
To build the tool, we plugged in the detailed characteristics that would define each of the six spatial categories. To do this we gathered real-life data for representative locations in Greater Cambridge, on various topics including typical types and sizes of development, types and amounts of non-residential buildings and infrastructure needed to serve new homes, typical numbers of people per household in different sizes and types of home, and transport patterns (which depend on type of transport available, and distance that people have to travel). We combined this with data on the carbon emissions of various activities such as grid electricity (current and future) and other fuel types, transport in the local area, and industry benchmarks for embodied carbon of typical new buildings (current, and future recommended targets).
Our starting point was to model one home in each spatial location, which gives us the annual carbon data in its rawest form. We modelled this twice – firstly with business-as-usual construction and transport practices as they stand today, and secondly with all the zero-carbon policies implemented to a reasonable level. As you can see in the graph below, the key takeaway is that zero-carbon policies have the potential to create a large positive impact.
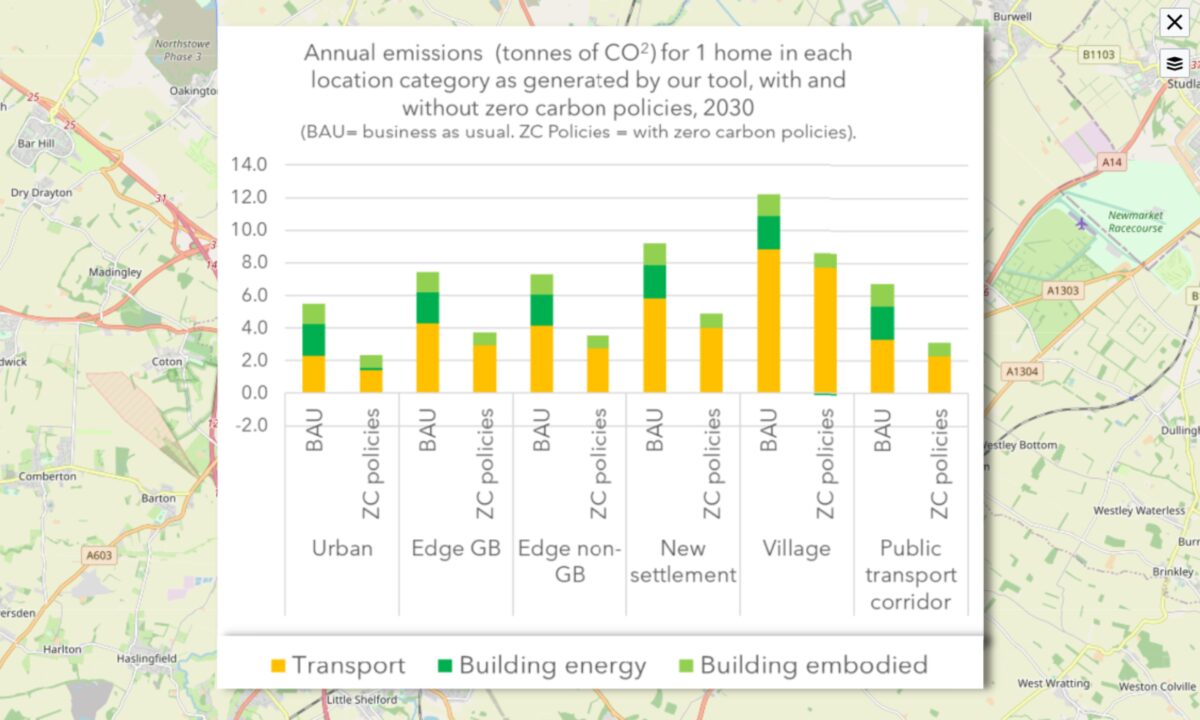
But this graph reveals another important fact: in a location where cars will realistically be the main transport choice, even with ‘zero carbon’ policies applied, the carbon emissions from transport are so high that this is still a worse option than if new homes were built in a dense urban area or public transport corridor even without zero carbon policies.
However, new homes will be spread across many types of location, and local planning authorities need to decide on the share of new development that each should accommodate, depending on the amount of land available.
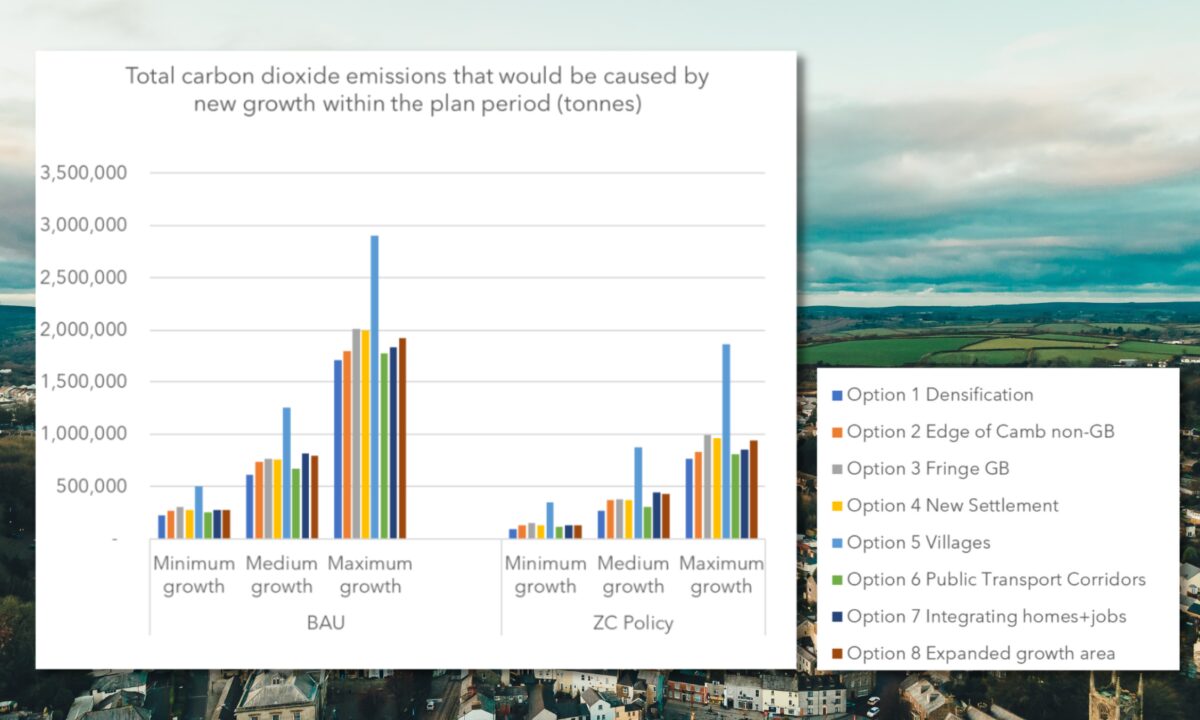
To inform these decisions, we mapped eight different growth options for Greater Cambridge – each of which is a different combination of spatial locations, with each location receiving varying proportions of the new homes. Each of these options is named for the type of location that would receive the largest share of growth. We then compared business-as-usual vs zero-carbon policy.
The impact
For Central Lincolnshire, the local plan recommended allocating its spatial growth sites based principally on reducing transport emissions and protecting green infrastructure as a carbon sink. To support this, new homes in a location where most trips will be by car should be required to provide electric vehicle charging infrastructure.
In Greater Cambridge, we helped illustrate that in a medium-growth scenario, and with zero-carbon policies applied, emissions from building energy use almost completely disappear, and transport and embodied carbon become the dominant sources of emissions.
The most crucial thing that the local plan can do is to choose spatial growth options that reduce car dependence
Central Lincolnshire Local Plan
For Central Lincolnshire, the local plan recommended allocating its spatial growth sites based principally on reducing transport emissions and protecting green infrastructure as a carbon sink. Any new growth that is necessary in a location where most trips will be by car should be required to provide electric vehicle charging infrastructure to support all of these.

We shouldn’t always assume that new development growth in a particular city or district must be a bad thing for climate... Increasing the number of homes within the tool simply means bringing those carbon emissions into this local planning authority’s view and taking responsibility for them.
Ultimately, if choosing a spatial option purely based on climate impact, we established that the best choice would be urban locations or public transport corridors, and to apply zero-carbon policies to ensure the new buildings have such little need for energy that they can mostly meet this demand with solar panels on their own roofs.
Looking beyond these graphs, it is important to note that we shouldn’t always assume that new development growth in a particular city or district must be a bad thing for climate. Although these graphs show higher carbon emissions from higher amounts of growth, we must consider what happens if the local plan did not make room for that growth. The number of homes reflects the estimated housing need in the area – and if this need is not met locally, it could instead be met in another local authority without such strong zero-carbon development policies, or result in people having to commute further to reach their place of work (emitting more carbon). Increasing the number of homes within the tool simply means bringing those carbon emissions into this local planning authority’s view and taking responsibility for them.
While it is crucial to build the homes of the future in a truly sustainable way, it is equally important to view any new developments within the context of the overall emissions that a local authority can influence – which includes the huge retrofit challenge. To help address this, Bioregional has also worked with Cambridge City Council to create a comprehensive retrofit guide for homeowners and landlords, which is available here.
- Download the Greater Cambridge Net-zero Carbon Evidence Base >>
- Download the Central Lincolnshire Local Plan >>
Interested in our Sustainability consultancy services for local authorities?
Get in touch, or click here to learn more about how we can help your local authority meet its climate challenges.

Contact us
Find out how we can help your project or local authority
Additional image credits: Dorin Seremet, James Feaver, Andrey Zaychuk, and Phil Hearing, all via Unsplash